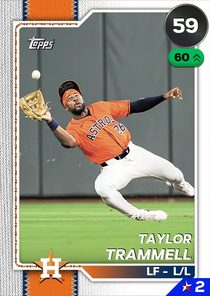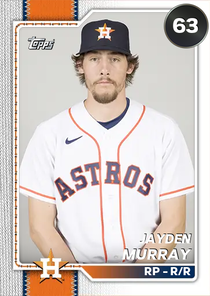



50 cards · 24h window
| Value Gapⓘ | ||||||
|---|---|---|---|---|---|---|
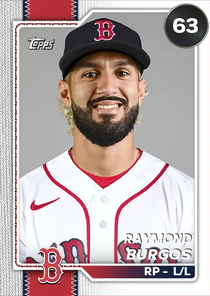
| RP |  62 62 | 13 | 75 | Pro | +476.9% | |
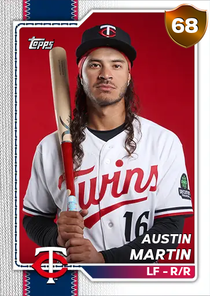
| RF | Bronze68 | 34 | 144 | Pro | +323.5% | |
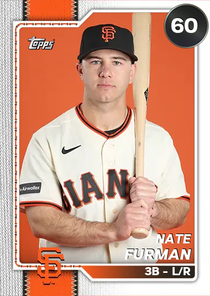
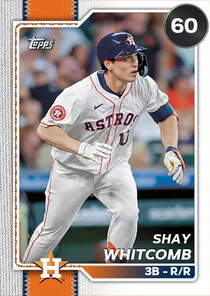
| 3B | 60 | 13 | 55 | Pro | +323.1% | |
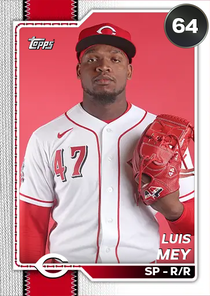
| RP | 64 | 19 | 66 | Pro | +247.4% | |
| CP | 55 | 23 | 78 | Pro | +239.1% | |
| RP | 58 | 17 | 56 | Pro | +229.4% | |
| CP | 64 | 35 | 115 | Pro | +228.6% | |
| SS | 56 | 35 | 114 | Pro | +225.7% | |
| SP | Bronze68 | 55 | 171 | Pro | +210.9% | |
| LF | 64 | 18 | 55 | Pro | +205.6% | |
| C | Bronze70 | 35 | 104 | Pro | +197.1% | |
| SP | 63 | 40 | 118 | Pro | +195.0% | |
| SP | Bronze69 | 45 | 131 | Pro | +191.1% | |
| 3B | 59 | 15 | 43 | Pro | +186.7% | |
| RF | 64 | 18 | 48 | Pro | +166.7% | |
| 1B | 63 | 20 | 50 | Pro | +150.0% | |
| RP | Bronze67 | 39 | 94 | Pro | +141.0% | |
| SP | 61 | 78 | 186 | Pro | +138.5% | |
| RP | Bronze71 | 55 | 129 | Pro | +134.5% | |
| SS | 55 | 12 | 28 | Pro | +133.3% | |
| RP | 60 | 48 | 111 | Pro | +131.3% | |
| RP | Bronze68 | 76 | 174 | Pro | +128.9% | |
| SP | Bronze73 | 80 | 180 | Pro | +125.0% | |
| RF | Bronze70 | 55 | 122 | Pro | +121.8% | |
| RP | 61 | 21 | 46 | Pro | +119.0% | |
| 3B | 63 | 42 | 91 | Pro | +116.7% | |
| SP | Bronze73 | 76 | 160 | Pro | +110.5% | |
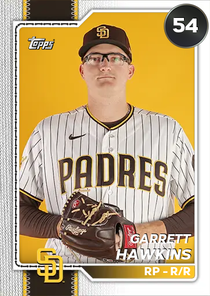
| RP | 54 | 22 | 46 | Pro | +109.1% | |
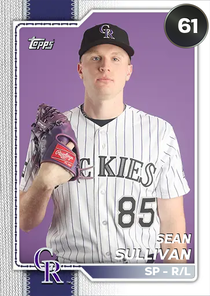
| SP | 61 | 11 | 23 | Pro | +109.1% | |
| CF | Bronze71 | 48 | 100 | Pro | +108.3% | |
| RP | Bronze67 | 51 | 105 | Pro | +105.9% | |
| 3B | Bronze70 | 58 | 119 | Pro | +105.2% | |
| 2B | 62 | 38 | 77 | Pro | +102.6% | |
| RP | Bronze68 | 42 | 85 | Pro | +102.4% | |
| RP | Bronze73 | 32 | 64 | Pro | +100.0% | |
| 1B | Bronze70 | 41 | 82 | Pro | +100.0% | |
| CP | Bronze65 | 88 | 175 | Pro | +98.9% | |
| C | 59 | 89 | 175 | Pro | +96.6% | |
| RP | 63 | 34 | 66 | Pro | +94.1% | |
| C | Bronze73 | 42 | 80 | Pro | +90.5% | |
| 3B | 63 | 20 | 38 | Pro | +90.0% | |
| SP | 63 | 60 | 114 | Pro | +90.0% | |
| C | Silver75 | 100 | 190 | Pro | +90.0% | |
| C | Bronze66 | 48 | 91 | Pro | +89.6% | |
| SP | 64 | 26 | 49 | Pro | +88.5% | |
| SP | Bronze65 | 66 | 124 | Pro | +87.9% | |
| LF | 61 | 21 | 39 | Pro | +85.7% | |
| RP | 59 | 145 | 22 | Pro | -84.8% | |
| RP | 62 | 68 | 7 | Pro | -89.7% | |
| SS | Red Diamond99 | 1,000,000 | 0 | Pro | -100.0% |
Create a free account to save watchlists, track your portfolio, and get price alerts.
Want more? See Pro plans — ad-free, real-time data, and portfolio tracking.
Prices in Diamond Dynasty are always moving; trending separates real directional moves from random daily churn. Risers show where demand is heating up — and where a flip window may be closing. Fallers show where bargains might be forming, or where a card is sliding for a reason worth understanding before you buy in.
Use trending as a context layer. Before you act on a flip or a buy, a ten-second glance here tells you whether you’re moving with the market or against it — and it pairs naturally with anomaly detection and the bot-risk signal so you don’t chase a manufactured rally.
What moves prices is predictable once you’ve watched a few cycles: roster updates re-rate cards overnight, new program and pack drops pull stubs toward fresh content, weekend flash sales flood supply, and ranked-season resets spike demand for meta pitching. The trending board is where those forces first become visible as numbers — a card climbing steadily for days is usually a rating or meta story, while a one-hour vertical spike is more often a content drop or a manipulated rally.
A raw price-change sort is dominated by noise — cheap cards swing double-digit percentages on a handful of sales, and thin markets gap around constantly. Trending filters that churn out and surfaces moves with real volume and persistence behind them, so a card on this board is moving because demand shifted, not because two listings crossed.
First ask why it’s rising. A rating bump or a new meta pitch is durable demand; hype around a content drop usually retraces within days; and a spike with a bot-risk flag is someone else’s exit liquidity. Cross-check the card’s price history and the anomaly signal before chasing — the riser list is a starting point for research, not a buy list.
Two things: bargains and warnings. A quality card sliding because a pack flooded supply is a buying window once the flood slows. But a card sliding because it fell out of the meta, or because a better version is about to release, keeps falling — the discount is not the bottom. The difference is usually visible in whether the card’s fundamentals (ratings, usability) changed or just its supply.
Pro and Diamond members see movers recomputed every 5 minutes; Free and Lite see the same board on a 30-minute refresh. For slow multi-day trends the delay barely matters, but for catching a move as it starts — or bailing out of one — the faster feed is the difference. Note that this cadence is specific to trending: the flip board refreshes every 60 seconds for every signed-in account, free tier included.